Demonstration project
Data Reconciliation Monitor
A morning check for Thornfield Retail Group, a fictional retailer whose warehouse is loaded every night from six source systems. It tells the business in plain words whether today's numbers can be used, and gives the data team the evidence behind the answer.
Synthetic data · fictional client · full model, DAX and data generator on GitHub.
The brief
Finance, trading and supply chain open their dashboards first thing in the morning. When a nightly load fails, nobody knows until a figure looks wrong in a meeting. Thornfield needed one page that says which data can be used today and which reports to hold back, and behind it the detail the data team needs to find and fix the cause.
What it showed
On the morning of 29 June:
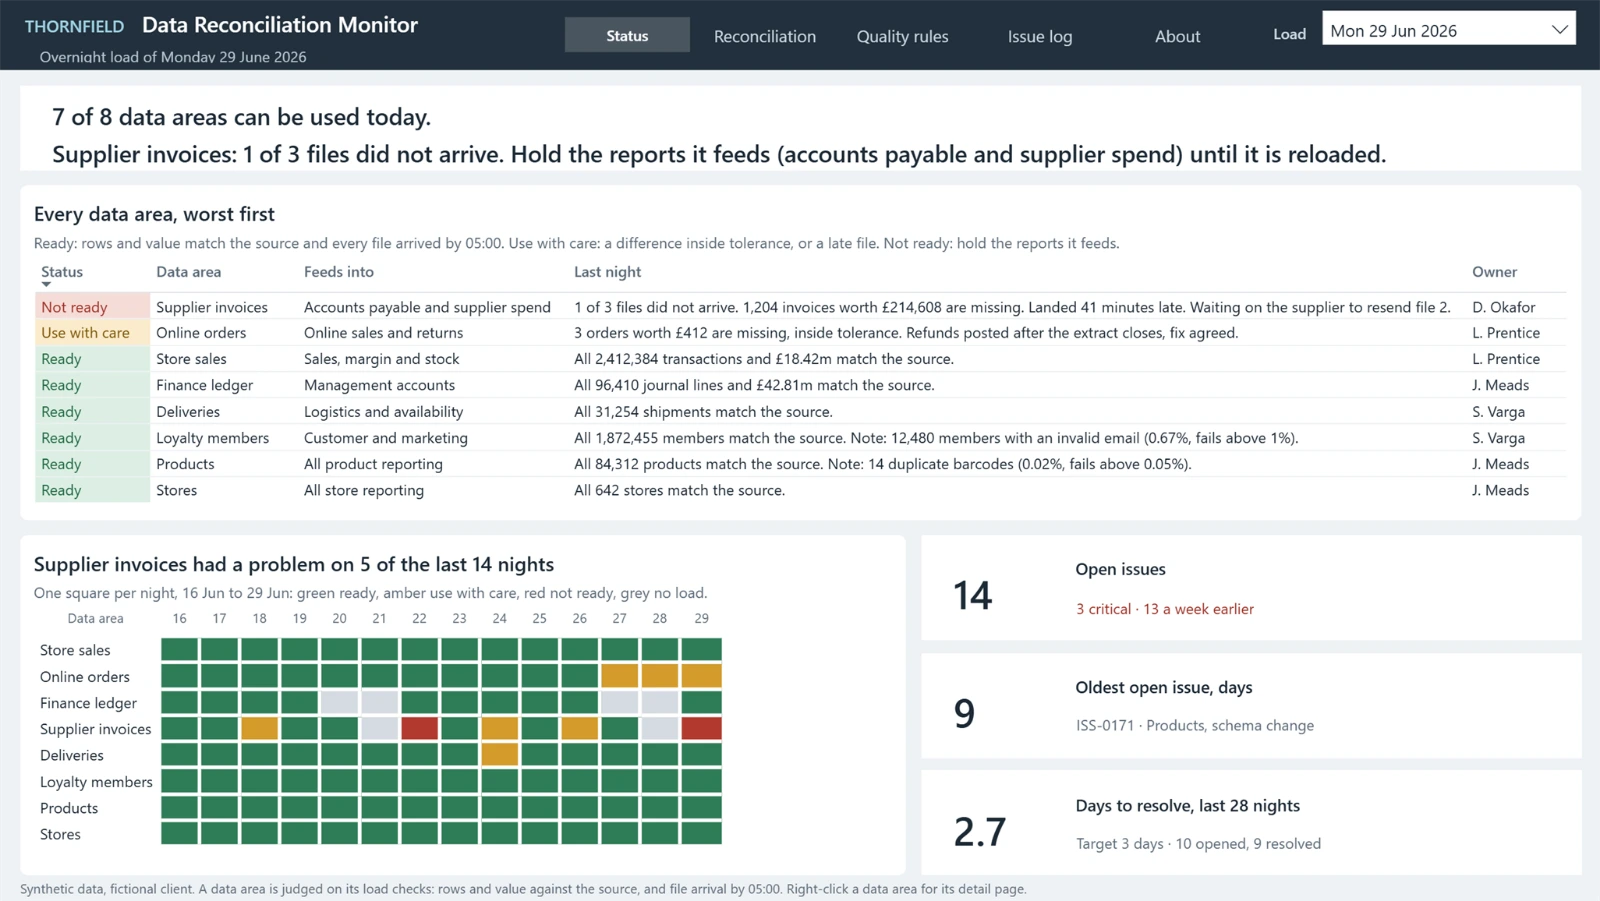
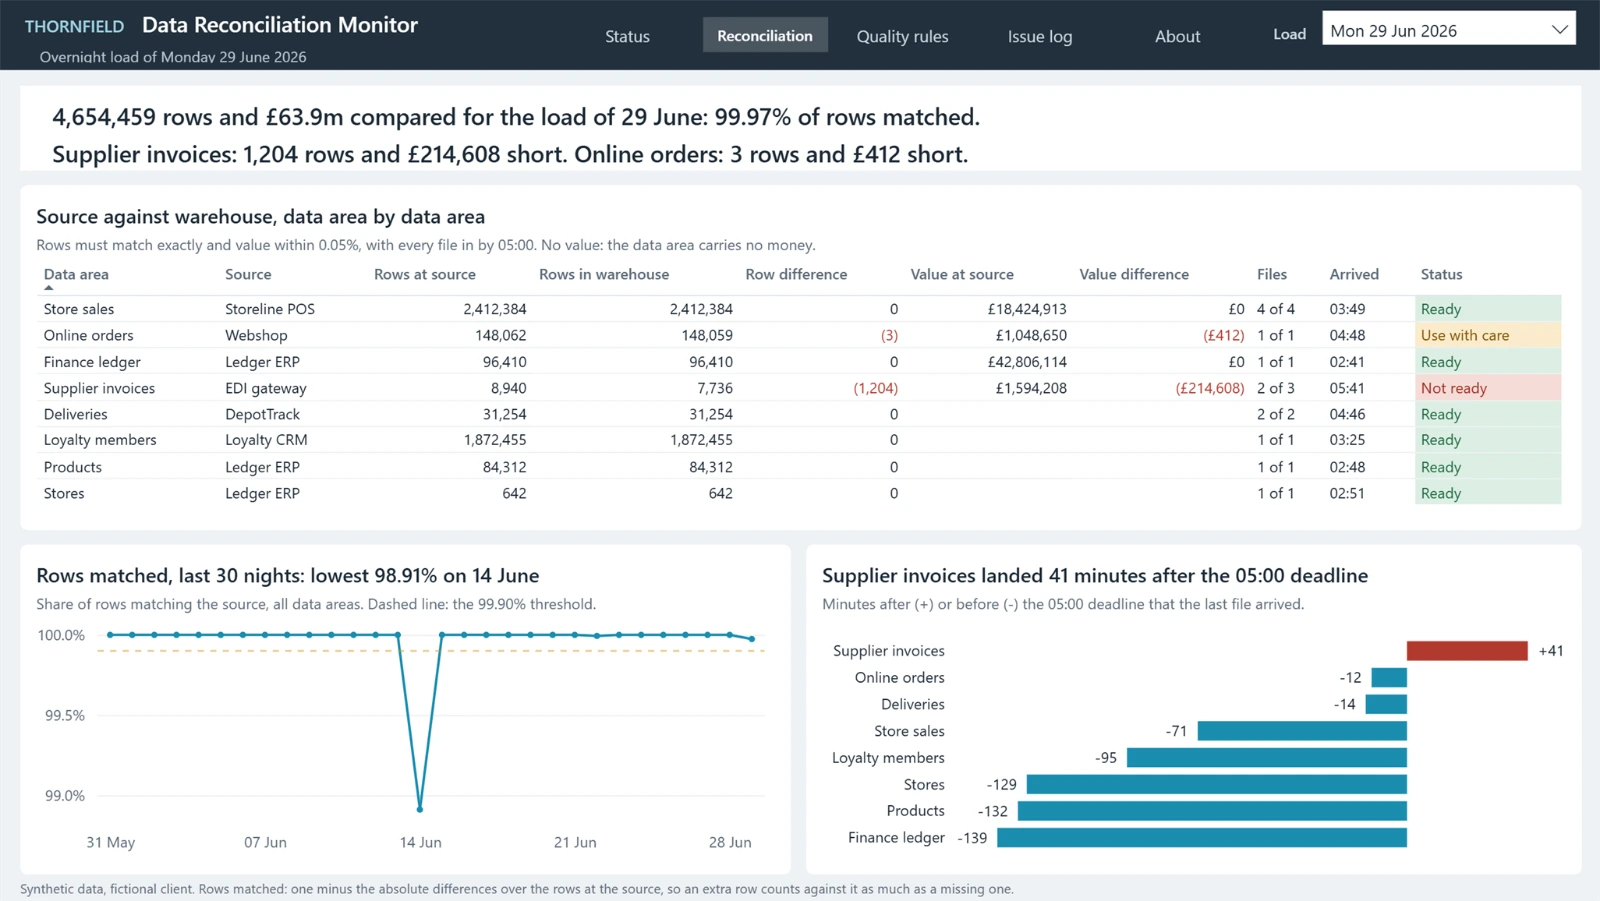
- Supplier invoices were not readyOne of three files never arrived, leaving 1,204 invoices worth £214,608 missing. The page tells finance to hold accounts payable and supplier spend reporting until the file is resent.
- Online orders could be used with careThree orders worth £412 were missing for the third night running, inside tolerance and traced to refunds posted after the extract closes. Fine for trends, worth checking before quoting exact totals.
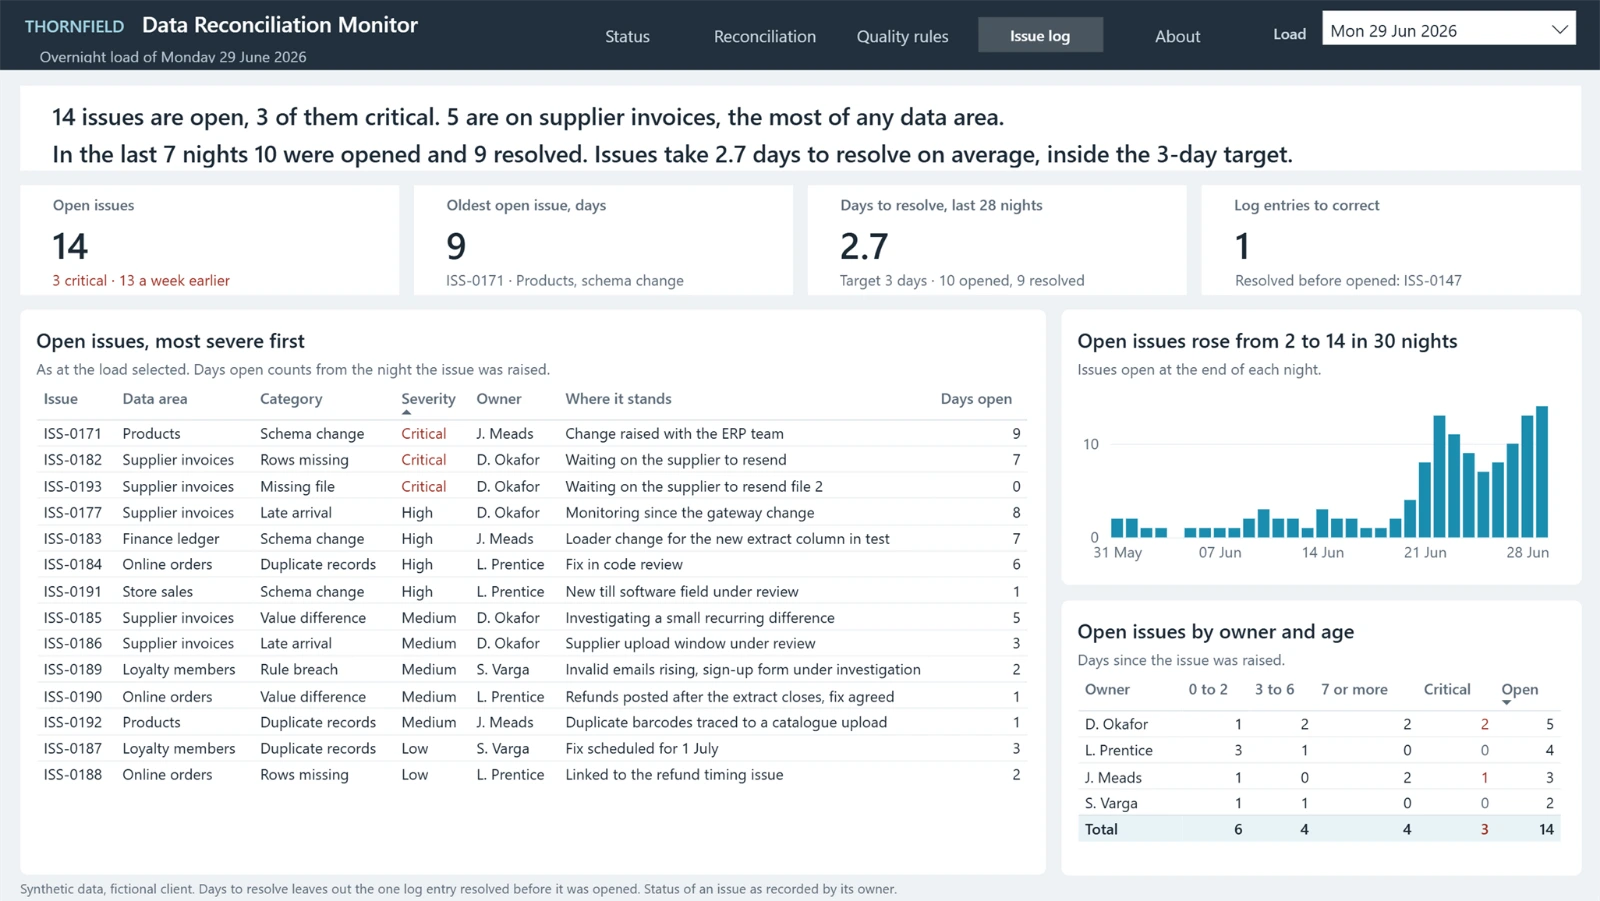
- Supplier invoices are the recurring problemThey had a problem on 5 of the last 14 nights and account for 5 of the 14 open issues, mostly late or incomplete files. The fix sits with the supplier's upload window rather than inside the warehouse.
- The team is keeping up, for nowIssues take 2.7 days to resolve against a 3-day target, but 14 are open, up from 2 a month earlier.
How it's built
The model stores measurements about the data rather than the data itself: rows and value at the source and in the warehouse, the files received and when, and the records failing each quality rule. No status is stored anywhere. Every status is worked out from the thresholds in one rulebook table, so changing a tolerance changes the whole report consistently.
Only the checks on the load itself decide whether an area can be used. A quality rule that warns afterwards, such as invalid emails in the loyalty data, shows as a note without holding a report back. Any night can be selected, and the issue log then shows what was open that morning. The monitoring data had faults of its own, from a rerun written twice to arrival times recorded three ways. Each is handled in the model.
The source
The semantic model, the DAX, the report and the script that generated the data are on GitHub, all readable as plain text.
All data in this project is synthetic. Thornfield Retail Group is a fictional client created to demonstrate the work, and no real client data appears anywhere in it.