Demonstration project
Site Inspection Performance
A monthly briefing for the operations review at Meridian Facilities Group, a fictional facilities operator inspecting 42 sites across six UK regions. The first page answers the review's four questions, and the pages behind it hold the detail.
Synthetic data · fictional client · full model, DAX and data generator on GitHub.
The brief
The head of operations and six regional managers review the inspection programme once a month. The data was there, hundreds of inspections a year against a 24-question checklist, but the meeting kept running out of time before it reached a decision. It needed four answers early: is compliance on target, are we inspecting as planned, are corrective actions closed on time, and which sites need a visit?
What it showed
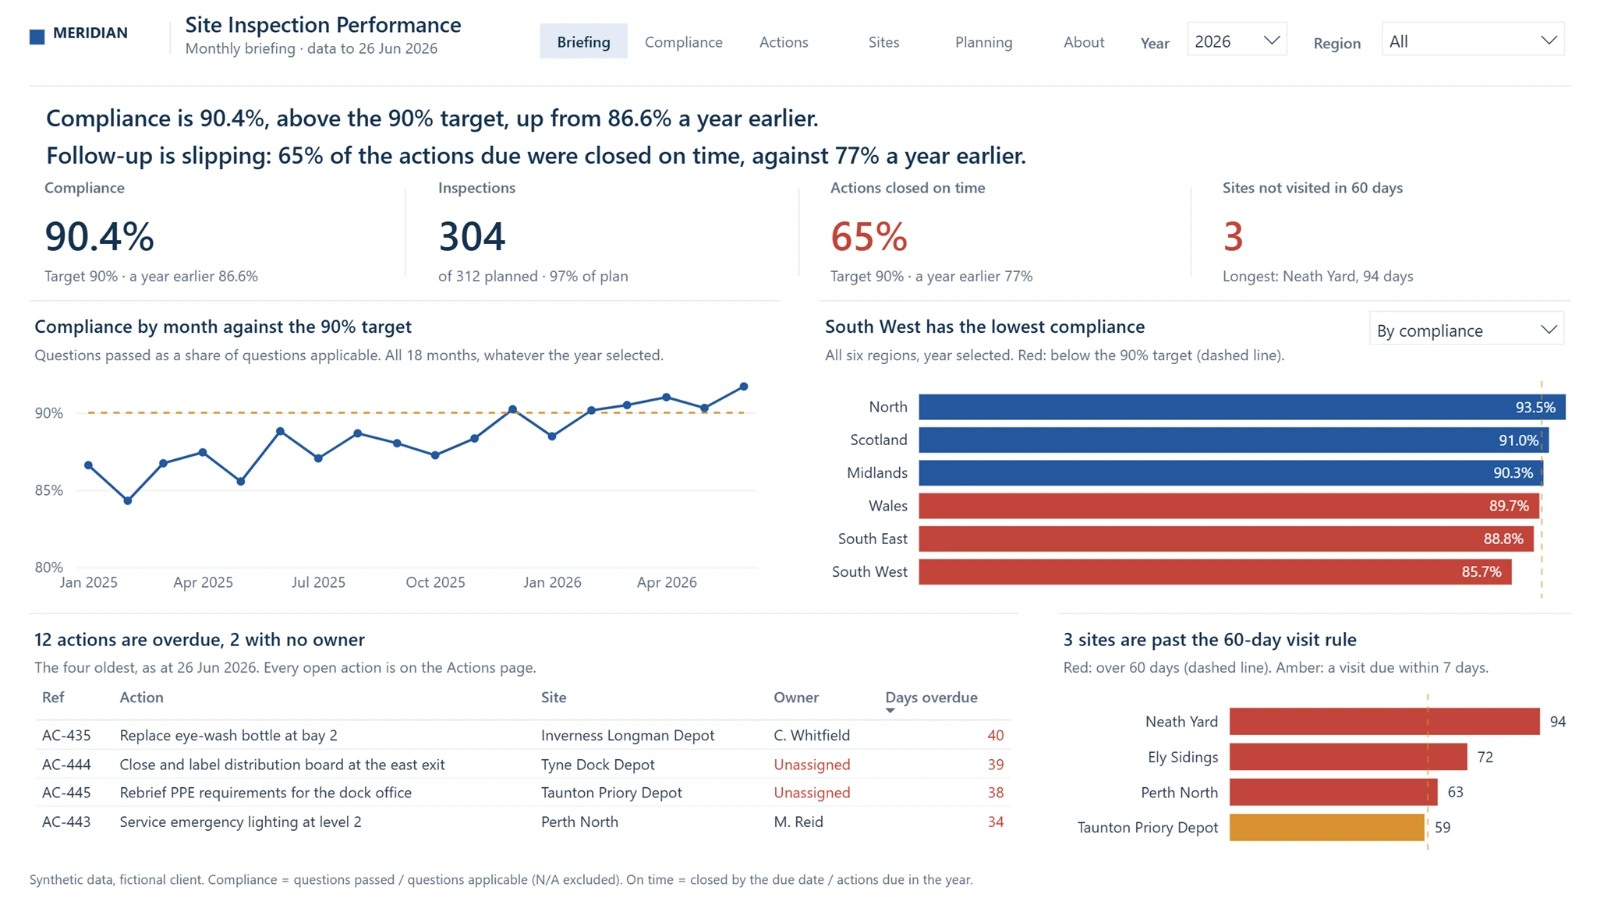
The briefing gives the four answers in two sentences and four figures.
- Compliance is on target90.4% so far this year, up from 86.6%. Three regions are still below 90%, with South West the lowest at 85.7%.
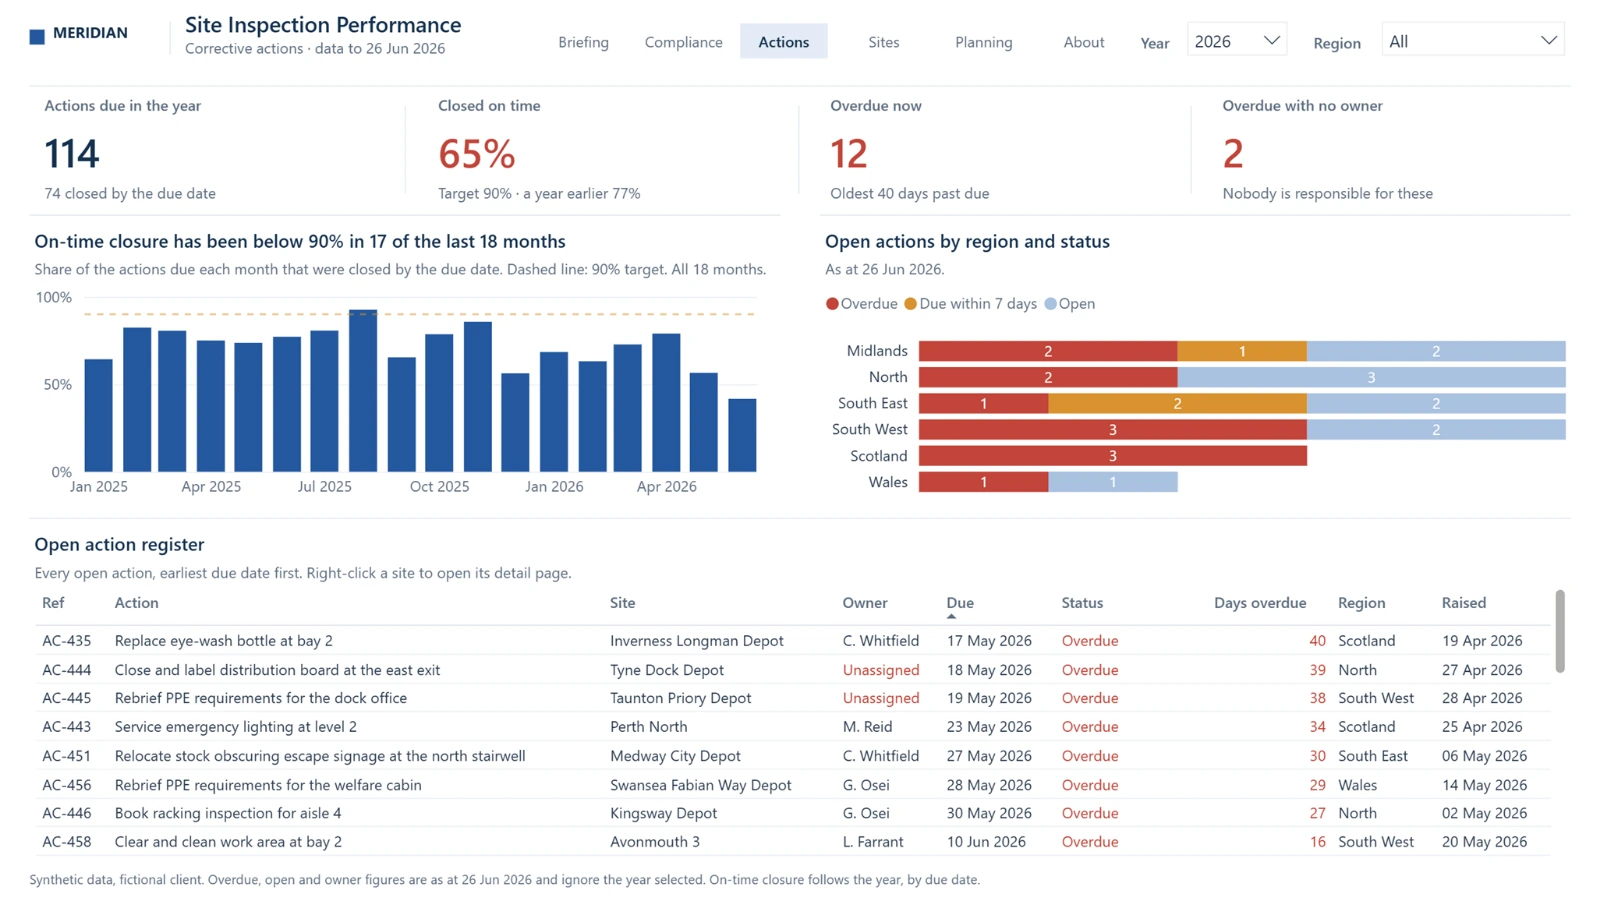
- Follow-up is where it slips65% of corrective actions were closed by their due date, against 77% a year earlier, and on-time closure has missed the 90% target in 17 of the last 18 months. Twelve actions are overdue and two have no owner, which is the first thing the review can fix.
- Three sites are past the 60-day visit ruleNeath Yard has gone 94 days without a visit, Ely Sidings 72 and Perth North 63.
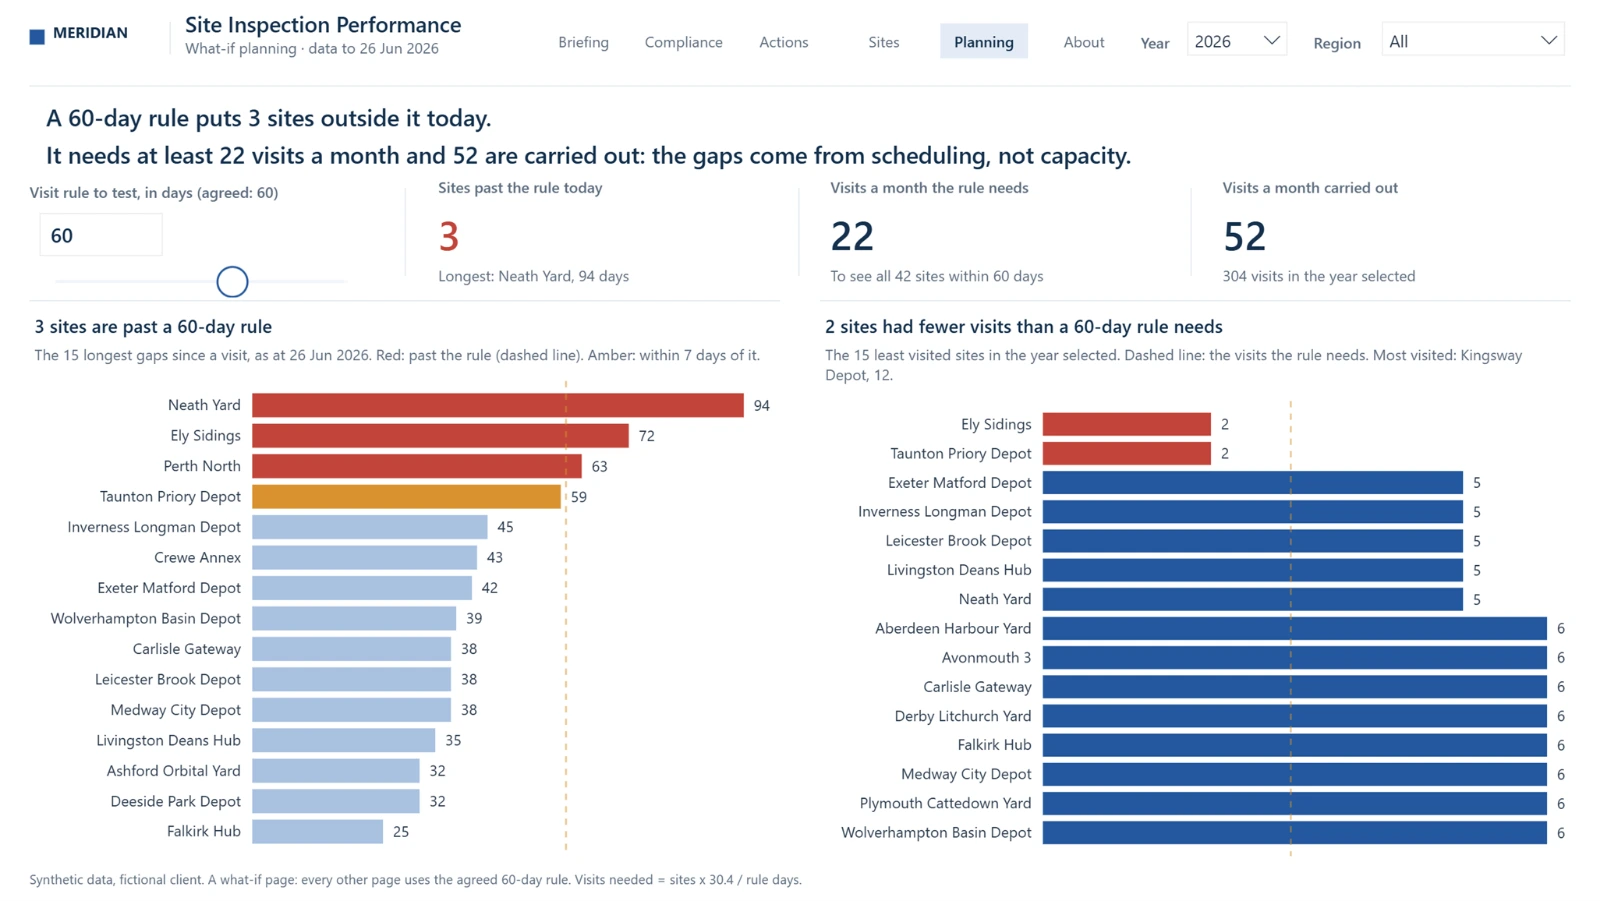
- The gaps come from schedulingThe Planning page tests the visit rule. Covering all 42 sites every 60 days takes 22 visits a month and 52 are being made, yet Kingsway Depot had 12 visits this year while Ely Sidings and Taunton Priory Depot had two each. A fairer schedule closes the gaps without adding inspectors.
How it's built
Compliance is one measure, questions passed over questions applicable, used everywhere from the estate trend to a single inspection, so the pages always agree. Every date is measured from the last inspection, 26 June 2026, rather than the system clock, so the report gives the same answers whenever it is opened. Actions are judged against the month they fell due, which is what makes the on-time figure fair.
The source export had the faults real exports have: duplicated inspections, site names typed differently, actions with no owner and one action pointing at an inspection that does not exist. Each is handled in the model and shown where it matters.
The source
The semantic model, the DAX, the report and the script that generated the data are on GitHub, all readable as plain text.
All data in this project is synthetic. Meridian Facilities Group is a fictional client created to demonstrate the work, and no real client data appears anywhere in it.