Demonstration project
Month-End Management Pack
A month-end pack for Ashcombe Partners, a fictional professional-services firm with four service lines. It is built for the close meeting, where the first question is always why profit is different from budget.
Synthetic data · fictional client · full model, DAX and data generator on GitHub.
The brief
Each month the finance director and the partners spent the first part of the close working out why profit had moved. They wanted that answered before the meeting started: how much of the gap was volume and how much was price, which costs moved, and which service lines and clients needed a conversation. The full P&L had to be there too, for anyone who wanted to check the figures.
What it showed
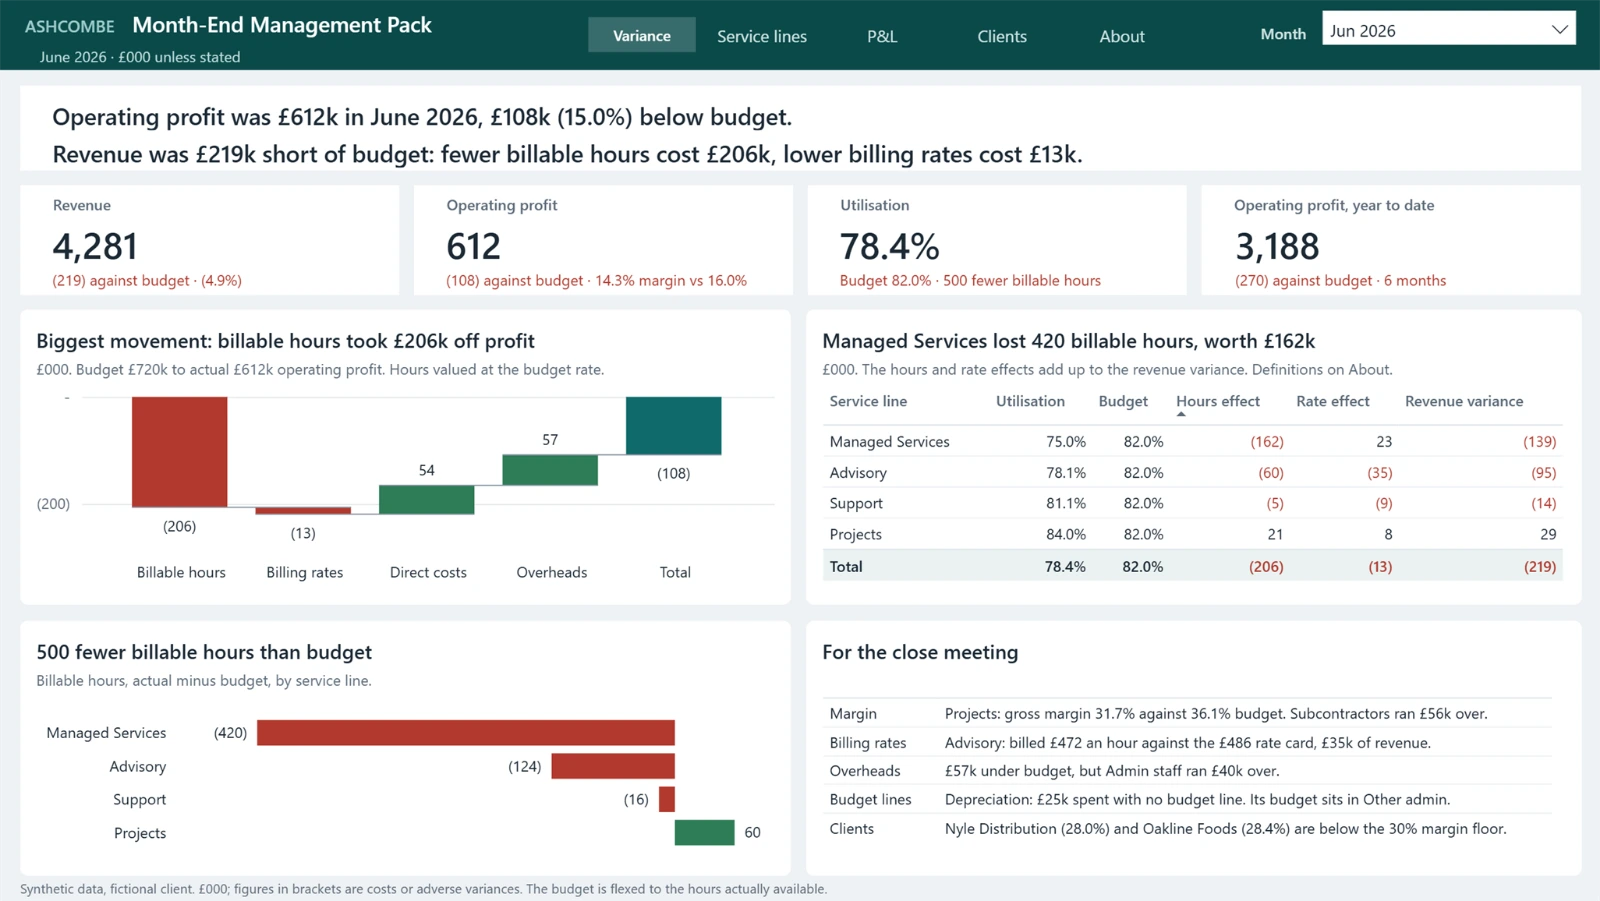
In June, operating profit was £612k against a £720k budget.
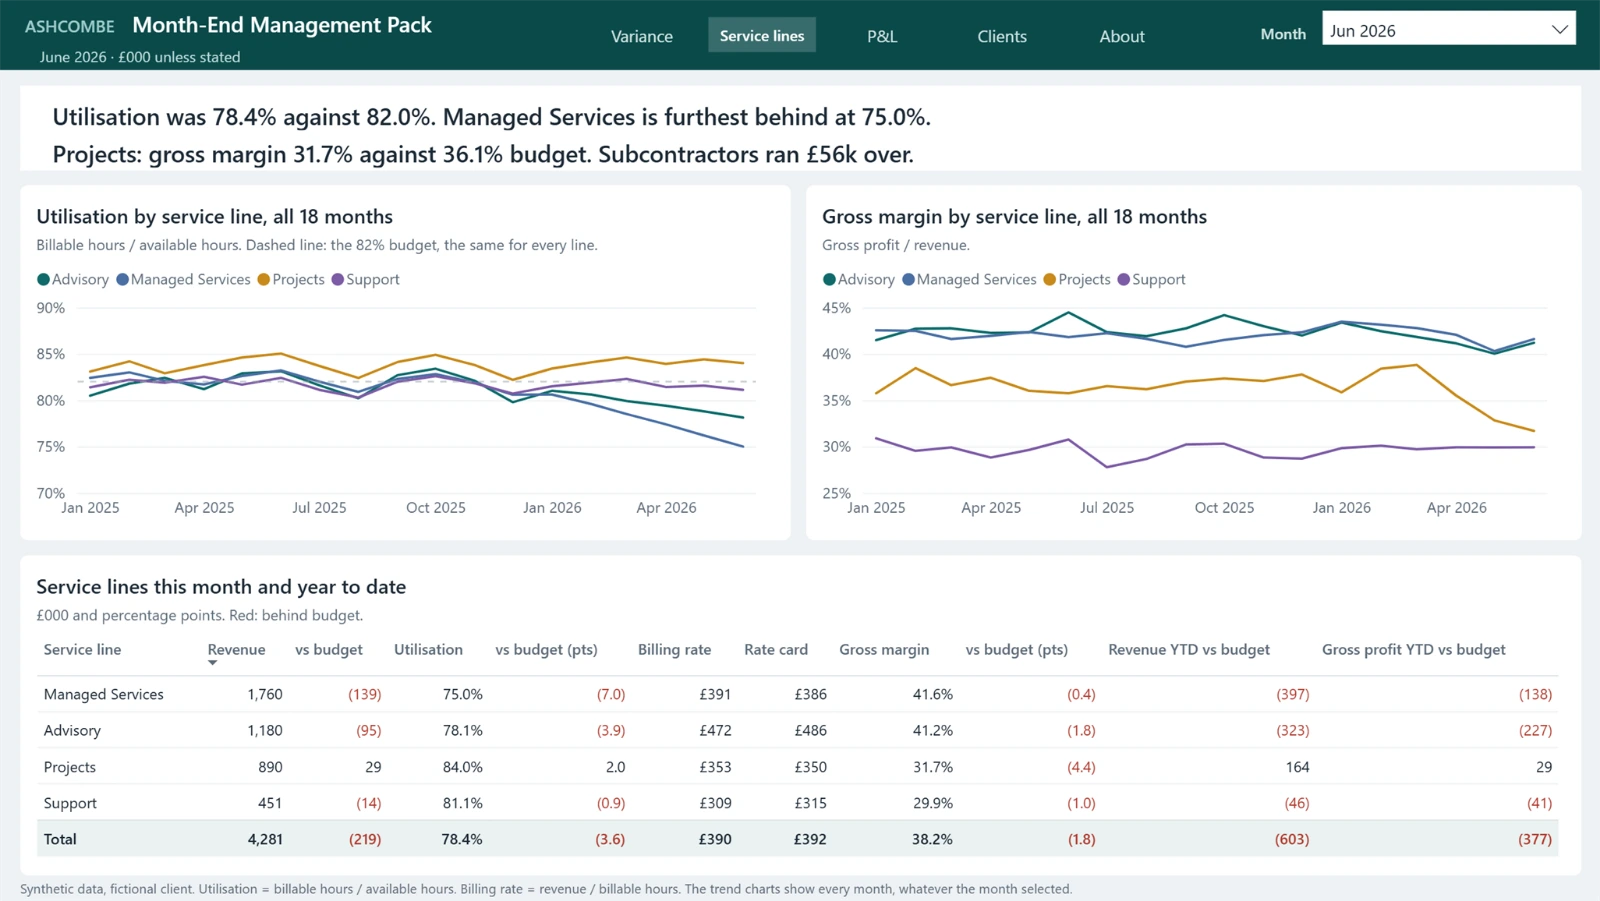
- The shortfall is billable hoursRevenue was £219k short, and £206k of that came from fewer hours billed. Managed Services alone lost 420 hours, with utilisation down from 80.6% in January to 75.0%. That is a resourcing question for the service line.
- Projects is losing margin to subcontractorsGross margin was 31.7% against 36.1% budgeted, with subcontractors £56k over.
- Advisory is discountingIt billed £472 an hour against a £486 rate card, which cost £35k of revenue in the month.
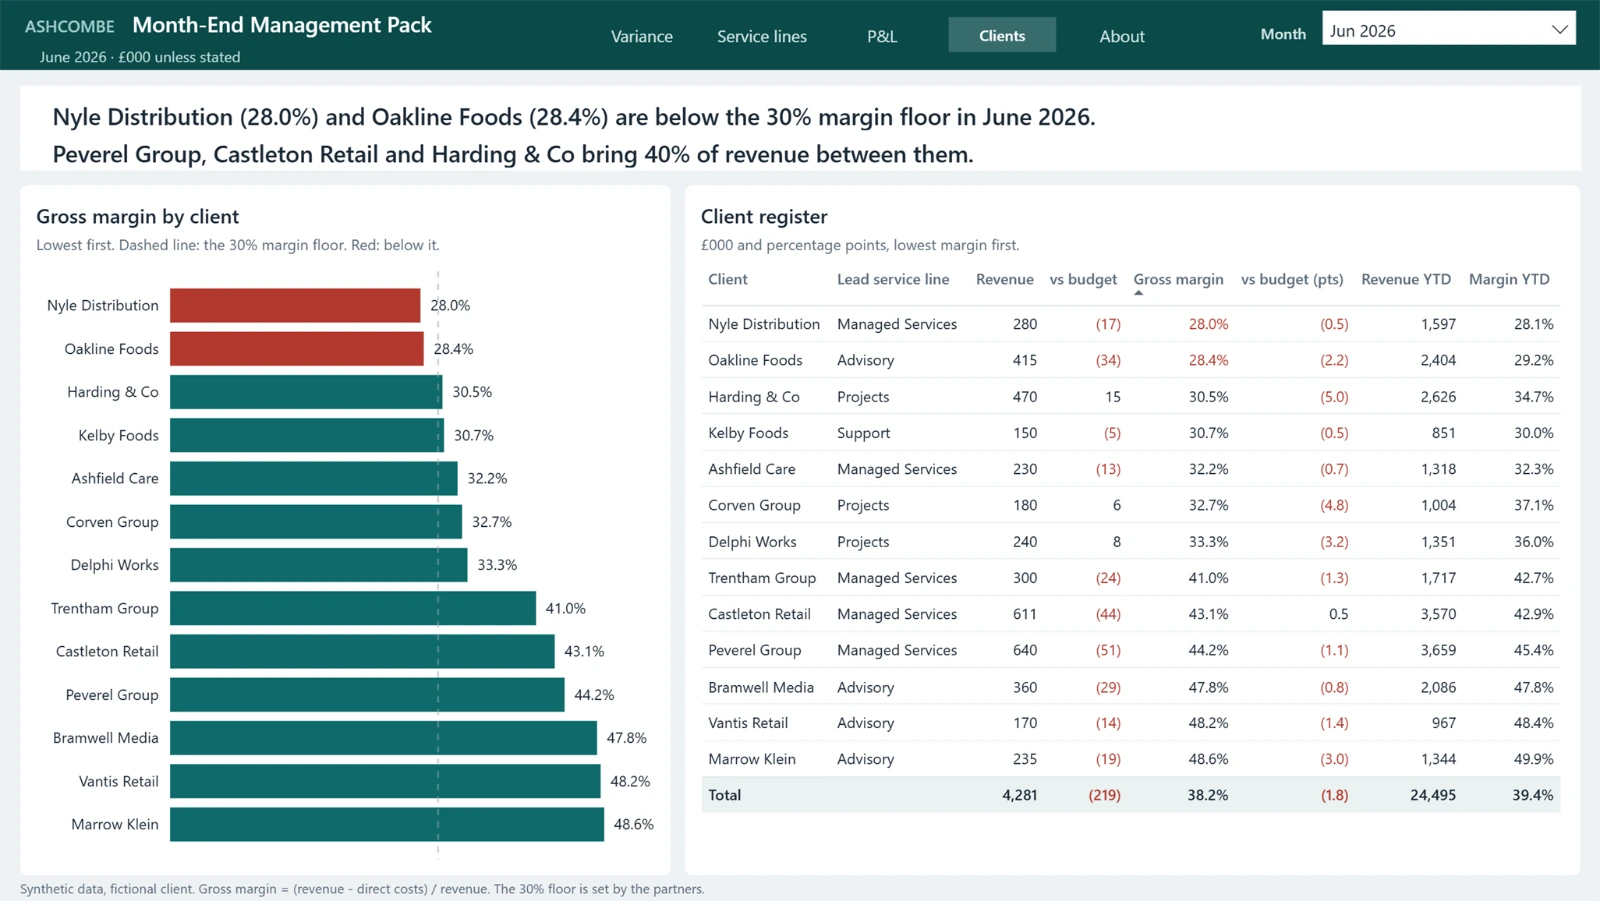
- Two clients are below the margin floorNyle Distribution at 28.0% and Oakline Foods at 28.4%, against the 30% the partners accept. Both are candidates for a pricing review.
- Overheads cushioned the monthThey came in £57k under budget, though admin staff costs have risen every month this year.
How it's built
The budget is flexed: budgeted utilisation and the rate card are applied to the hours each team actually had, so leave and vacancies do not show up as missed budget. What remains of the revenue variance splits into hours and rates, worked out service line by service line and month by month, so a shift towards cheaper work is not mistaken for discounting.
Amounts are stored as profit contributions, revenue positive and costs negative, so a positive variance is good news on every line. The points for the meeting are written by the model from the month's figures and change with the month selected. The ledger came with the usual faults: a journal batch exported twice, client names typed by hand, a cost posted with the wrong sign and depreciation with no budget line of its own. Each is handled before it reaches the report.
The source
The semantic model, the DAX, the report and the script that generated the data are on GitHub, all readable as plain text.
All data in this project is synthetic. Ashcombe Partners is a fictional client created to demonstrate the work, and no real client data appears anywhere in it.